Leaking pipes

Getting water to your home

Water is brought to your homes through thousands of kilometres of underground pipes. For various reasons, pipes can leak and some water is lost between the treatment works and your home.
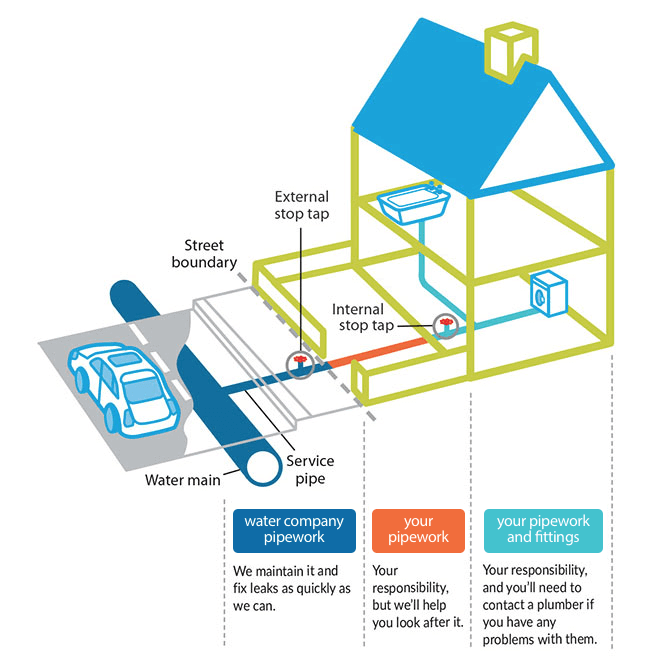
350,277km Length of water pipes (mains) owned by water companies
Equivalent to
8.6 times
around the equator

Source: Water UK; England and Wales, Apr 2022 – Mar 2023

3,037 Million litres of water leaked each day
Equivalent to
1,215
Olympic swimming pools per day

Source: Water UK; England and Wales, three year average Apr 2020 - Mar 2023

Click for company comparison Close Panel

Water companies have reduced leakage by a third from the 1990s and continue to manage leakage closely. All companies have targets for the amount of water that leaks from pipes.

How can companies be compared?

There are different ways to compare how companies are doing on leakage:

• Comparing how each company is doing against its target

All companies have targets for how much water leaks from pipes – are they meeting, beating or failing them?

Targets differ for each company, depending on how much it costs to reduce leakage in each area and how much extra water from reducing leaking is worth – in money, to the environment and to customers. The targets are approved by the regulator, Ofwat, and set so that bills are no higher than they need to be.

• Comparing companies against each other

Because the size of areas companies supply can vary considerably, the amount of leakage in each company’s area is different. To compare companies against each other, you can either look at how much leakage there is per length of pipe – or how much leakage there is per property.

Why might the leakage levels and targets vary?

Targets for leakage are based on comparing the cost of getting extra water by reducing leakage and the cost of getting extra water from other sources, in each part of the country. So leakage targets, and the level of leakage, will vary depending on local costs and water availability in that region. The targets also include how important customers think reducing leakage is, and this varies across the country too.

Leakage can also vary due to:

• Extreme weather conditions - hot and dry weather or freezing cold leads to the ground expanding or contracting around water mains pipes, resulting in bursts

• The age of the pipe network in a particular region - older pipes tend to leak more

• Pipe material – some materials are more prone to bursting than others

• Differences in water pressure

• Soil conditions - corrosion can lead to some pipe materials being eaten away

• Damage to pipes - in cities and towns, heavy traffic compresses the soil around pipes and can damage them.

Have companies met their targets?

All companies have been set targets to reduce leakage compared to a baseline level of performance. These targets are averaged over three years as the weather can affect performance in individual years. The graph shows whether companies have met their targets for the latest three years. If leakage have been reduced by more than the target, the company has beaten the target and saved extra water.

Change in three-year average leakage compared to baseline (%)

      Change in three-year average leakage compared to baseline (%)

      Source: Water UK

      Total leakage

      This graph shows the three year average of total leakage for each company, in millions of litres of water leaked each day.


          Three year average leakage (ML per day)

          Source: Water UK

          Cubic metres of water leaked (per kilometre per day)

          To compare companies of different sizes, this graph shows the volume of water leaked from each company’s pipes compared to the overall length of water pipes the company has. This graph shows the average leakage for the latest three years compared to the length of water pipes in the latest year.

              Three year average cubic metres of water leaked per day per kilometre of mains (latest year)

              Source: Water UK

              Litres of water leaked (per property per day)

              To compare companies of different sizes, this graph shows the volume of water leaked from each company’s pipes compared to the overall length of water pipes the company has. This graph shows the average leakage for the latest three years compared to the number of properties in the latest year.

                  Three year average litres of water leaked per day per property (latest year)

                  Source: Water UK

                  Cubic metres of water leaked (per kilometre per day)

                  To compare companies of different sizes, this graph shows the volume of water leaked from each company’s pipes compared to the overall length of water pipes the company has. The graph shows how companies compare on leakage over the last three years.

                      Cubic metres of water leaked (per kilometre per day)

                      Source: Water UK

                      Litres of water leaked (per property per day)

                      To compare companies of different sizes, the graph shows the volume of water leaked from each company’s pipes compared to the number of properties the company supplies. The graph shows how companies compare on leakage over the last three years.

                          Litres of water leaked (per property per day).

                          Source: Water UK

                          Water pipes - which do you own?

                          It is helpful to know which pipes are water companies' responsibility and which ones are yours.

                          Water pipes - which do you own?
                          • There are many reasons why water pipes leak. Some are old and have worn out through gradual corrosion, and others can get damaged by freezing weather.

                            Ground movement, such as natural shifts in building foundations, can also put a strain on pipework.

                          • If you spot a leak on the street, the best thing to do is report it to your water company as soon as possible.

                            In your home, some leaks such as dripping taps are obvious but others can be hidden, for example:

                            • Behind a poorly plumbed appliance
                            • In a rarely-seen water tank
                            • Due to an overflowing toilet cistern

                            If you think you may have a leak and you are on a water meter, check your meter reading to see if it is rising even when all water appliances are off (remember to wait 30 minutes to allow any cisterns to fill).

                            If you find a leak in your pipes, contact a WaterSafe certified plumber.

                          Spotted a leak?

                          Please contact your local water company. Don’t know who your supplier is? Find out here

                          Your browser is out of date!

                          Please update your browser to view this website correctly.